Index
Introduction
Ever wanted to see how your movements affect a display in real-time? In this blog post, we demonstrate how to use the MPU6050 gyroscope sensor and an OLED display with Arduino to create a dynamic circle visualizer. This project is perfect for learning about sensor data visualization and getting hands-on with Arduino programming.
This project provides an interactive way to visualize sensor data using an MPU6050 gyroscope sensor and an OLED display with Arduino. It’s a great introduction to real-time data visualization and can be expanded for various applications, including robotics, gaming, and educational tools. Happy building!
Required Components
- Arduino UNO, or Nano
- OLED display
- MPU6050
- Jumper wire
- Breadboard
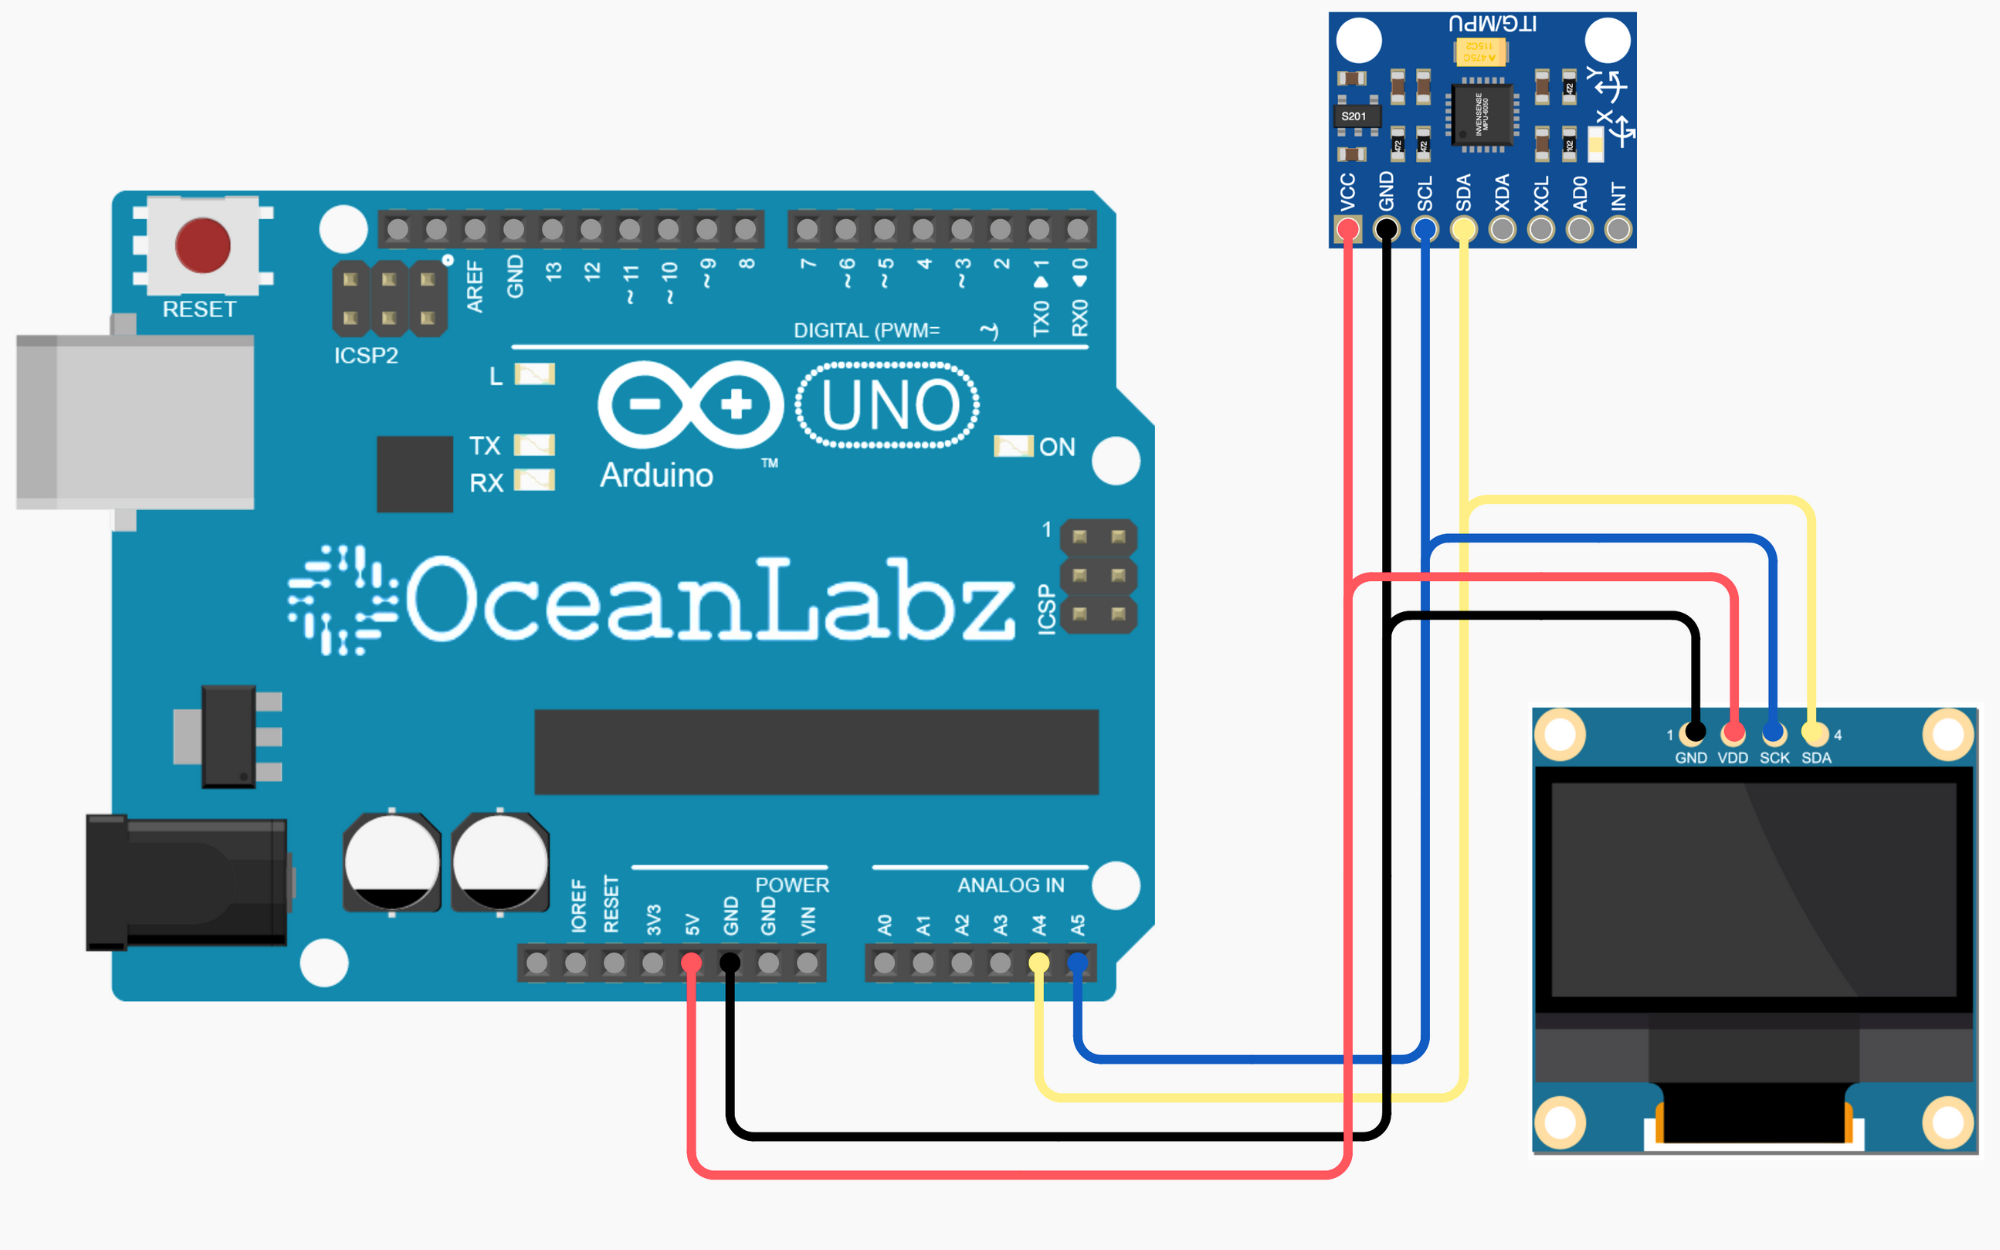
Circuit Diagram / Wiring
- MPU6050 Sensor
- MPU6050 VCC → 5V (Arduino)
- MPU6050 GND → GND (Arduino)
- MPU6050 SDA → Pin A4 (Arduino)
- MPU6050 SCL → Pin A5 (Arduino)
- OLED Dispaly
- OLED VCC → 5V (Arduino)
- OLED GND → GND (Arduino)
- OLED SDA → Pin A4 (Arduino)
- OLED SCK → Pin A5 (Arduino)
Arduino Code / Programming
Library Installation
Make sure you have the following libraries installed:
- Adafruit GFX Library
- Adafruit SSD1306 Library
- MPU6050 Library
#include <Wire.h>
#include <Adafruit_GFX.h>
#include <Adafruit_SSD1306.h>
#include <MPU6050.h>

#define SCREEN_WIDTH 128
#define SCREEN_HEIGHT 64
#define CIRCLE_RADIUS 10

Adafruit_SSD1306 display(SCREEN_WIDTH, SCREEN_HEIGHT, &Wire, -1);
MPU6050 mpu;

int16_t circleX = SCREEN_WIDTH / 2;
int16_t circleY = SCREEN_HEIGHT / 2;
float gyroXSmoothed = 0.0;
float gyroYSmoothed = 0.0;
float smoothingFactor = 0.9;
int16_t gyroThreshold = 100;
bool isGyroActive = false;

void setup() {
  Serial.begin(9600);
  Wire.begin();
  if (!display.begin(SSD1306_SWITCHCAPVCC, 0x3C)) {
    Serial.println("SSD1306 allocation failed");
    while (true);
  }
  mpu.initialize();
  display.clearDisplay();
  display.display();
}

void loop() {
  int16_t gyroX, gyroY;
  mpu.getRotation(&gyroX, &gyroY, NULL);

  gyroXSmoothed = smoothingFactor * gyroXSmoothed + (1 - smoothingFactor) * gyroX;
  gyroYSmoothed = smoothingFactor * gyroYSmoothed + (1 - smoothingFactor) * gyroY;

  if (abs(gyroX) > gyroThreshold || abs(gyroY) > gyroThreshold) {
    isGyroActive = true;
    circleX -= gyroXSmoothed / 100; // Inverted left-right movement
    circleY += gyroYSmoothed / 100;
    if (circleX < CIRCLE_RADIUS) circleX = CIRCLE_RADIUS;
    if (circleX >= SCREEN_WIDTH - CIRCLE_RADIUS) circleX = SCREEN_WIDTH - CIRCLE_RADIUS - 1;
    if (circleY < CIRCLE_RADIUS) circleY = CIRCLE_RADIUS;
    if (circleY >= SCREEN_HEIGHT - CIRCLE_RADIUS) circleY = SCREEN_HEIGHT - CIRCLE_RADIUS - 1;
  } else {
    if (isGyroActive) {
      int16_t lastCircleX = circleX;
      int16_t lastCircleY = circleY;
      circleX = SCREEN_WIDTH / 2;
      circleY = SCREEN_HEIGHT / 2;
      display.clearDisplay();
      display.fillCircle(lastCircleX, lastCircleY, CIRCLE_RADIUS, WHITE);
      display.display();
      isGyroActive = false;
    }
  }

  display.clearDisplay();
  display.drawRect(0, 0, SCREEN_WIDTH, SCREEN_HEIGHT, WHITE);
  display.drawRect(1, 1, SCREEN_WIDTH - 2, SCREEN_HEIGHT - 2, WHITE);
  display.drawRect(2, 2, SCREEN_WIDTH - 4, SCREEN_HEIGHT - 4, WHITE);
  display.fillCircle(circleX, circleY, CIRCLE_RADIUS, WHITE);
  display.display();

  delay(50); // Adjust the delay as needed
}
Explanation
- The code uses an MPU6050 gyroscope to detect rotational motion and dynamically moves a circle on an OLED display.
- Gyroscope values are smoothed, and movement is triggered only if they exceed a defined threshold.
- The circle’s position resets to the screen center when motion stops, and its previous location is briefly highlighted.
- The OLED display renders a bordered screen with the circle’s updated position in real-time.

